
By John Cudahy and Dan Hollowell
As we move into the busiest portion of the 2019 North American air show season, the ICAS staff recently took a retrospective look at air show and practice accidents during the last 22 years. It’s information that could prove useful to ICAS members during the next several months.
Traditionally, ICAS has closely tracked the number of North American air show fatalities during actual air shows. By that measure, safety has demonstrably and quantifiably improved in the U.S. and Canada during the last 30 years (see Graph A). Although the industry continues to experience tragic spikes (see 2007 and 2011 as examples), the overall trend is encouraging and the average number of fatal accidents is down significantly, not just compared to the horrific years of 1988, 1989 and 1990, but even when judged against a decade like 1991-2000 when North American air shows saw an average of 4.4 fatalities per year.
But, even though a simple statistic like “air show fatalities” might be an easy benchmark against which to measure our safety performance from one year to the next, it offers little in the form of helpful direction or useful analysis. For that, we have to dig into the numbers to provide some additional context and detail.
First, a few caveats. Although they include practice accidents and rides after and before air shows, these statistics do not include air race accidents, cross-country accidents or accidents involving static display aircraft arriving at or departing from an air show. Also, it’s important to recognize that there are often multiple ways to analyze and report on the same statistics; there is nothing definitive or absolute about what we are presenting here. Neither of us are a) aerobatic experts or b) statisticians. Finally, we have deliberately scrubbed the article of specific names and incidents so that we can stay focused on general trends and not be distracted by the details, particulars and emotion of specific accidents.
Based on our analysis of multiple sources, between June of 1997 and October of 2018, there were 93 accidents or major incidents during air shows, practice sessions, post- or pre-air show rides and air show-related photo missions. That works out to 4.23 accidents/incidents per year. Of those 93 accidents and incidents, 60 (64.5%) occurred during first 11 years of that 22-year period (5.5 per year) and 33 (35.5%) during the second 11 years (3.0 per year).
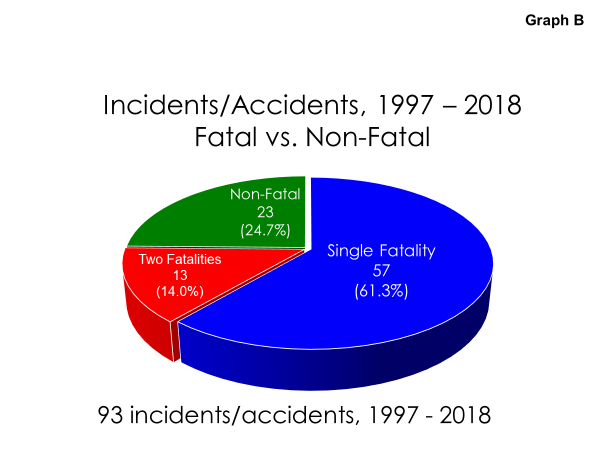
Of all those 93 accidents since 1997 in North America, 57 (61.3%) involved a single fatality, 13 (14.0%) had two fatalities, and 23 (24.7%) had no fatalities (see Graph B).
There were 110 different people involved in those 93 accidents and incidents, with 84 (76.4%) ultimately dying in the accident or from injuries sustained in the accident. That’s 3.82 fatalities per year…56 fatalities during the first eleven years of that 22-year period (5.09 fatalities per year) and 28 fatalities during second eleven years (2.5 fatalities per year). Among those accidents involving two fatalities, five were mid-air collisions, four involved military aircraft with a crew of two, three involved pre-show or post-show aerobatic rides with passengers, and we had a single accident with two fatalities that involved a pilot/wingwalker team.
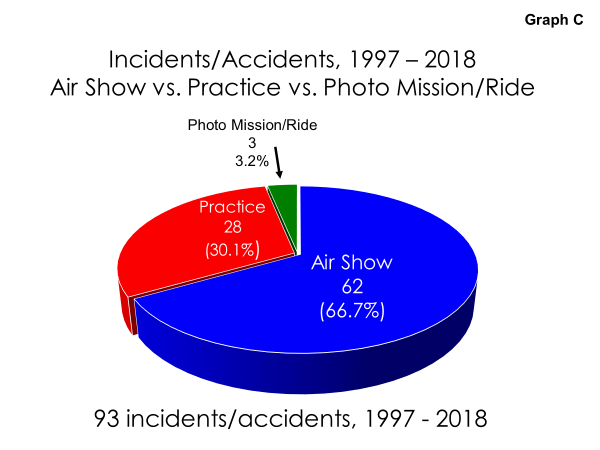
Among the 93 accidents and incidents since 1997, 62 (66.7%) occurred during an air show, 28 (30.1%) occurred during a practice session, and three (3.2%) happened during a photo mission or incentive ride (See Graph C).
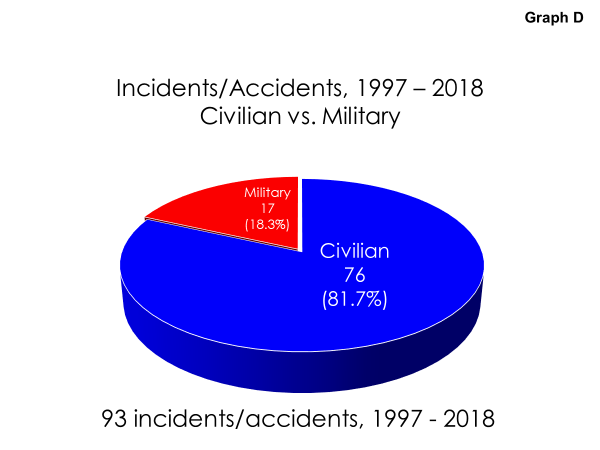
Of the 93 accidents reviewed between the beginning of the 1997 air show season and the end of the 2018 season, 76 (81.7%) involved civilians and 17 (18.3%) involved military (See Graph D).
Of the 76 accidents involving civilians, 60 involved 63 pilots who held Statement of Aerobatic Competency (SAC) cards issued by the FAA or Transport Canada at the time of the accident: 33/52.4% had unlimited/surface cards, 14/22.2% had 250’ cards, eight/12.7% had 500’ cards and eight/12.7% had 800’ cards (See Graph E).
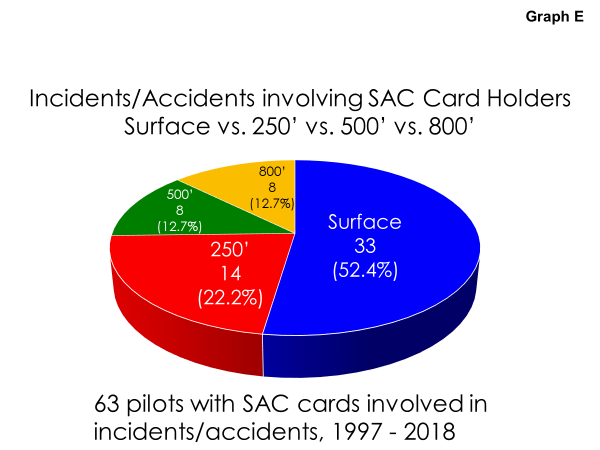
In 2019, 55.4% of the total number of SAC cards are surface cards, 25.5% are 250’ cards, 12.4% are 500’ cards and 6.7% are 800’ cards. Which means that the percentage of accidents involving surface card holders, 250’ card holders and 500’ card holders correlates roughly with the overall percentages of pilots holding cards at those levels. This largely dispels the belief among some that a disproportionate percentage of accidents is attributable to pilots with a particular altitude restriction on their SAC cards. The only place where we see a spike is with pilots holding 800’ cards. Although just 6.7% of all current SAC cards are 800’ cards, 800’ card holders account for 12.7% of accidents between 1997 and 2018.
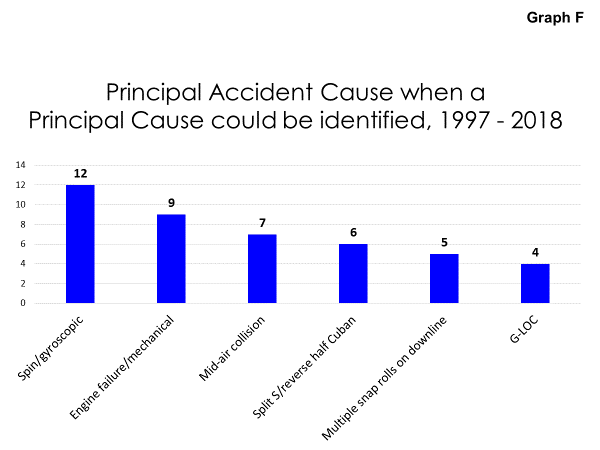
Although the precise cause of an accident — particularly a practice accident — is not always possible to determine, there are several types of recurring accidents. Of the 93 accidents since 1997, it was possible to assign a specific cause to less than half. But, based on post-accident reports and/or post-accident video analysis, the most common causes of air show and practice accidents during this 22-year period were:
- insufficient altitude to recover from a spin and/or gyroscopic maneuver (12);
- engine failure or other mechanical problem (9);
- mid-air collisions (7 with 10 fatalities);
- Split S or reverse half Cuban in which the pull was initiated too low to allow enough altitude to recover (6);
- insufficient altitude to recover following multiple snap rolls on a downline (5); and
- G-LOC-related accidents (4). (See Graph F)
This specific list of causal factors and our overall analysis provide an important risk mitigation tool and helpful insight for every air show performer as he/she prepares to practice or perform. Specifically…
- It is a truism in our business that spins and gyroscopic maneuvers should not be introduced to an air show sequence until the maneuver has been practiced and executed predictably 100 times out of 100 times at altitude. But this analysis strongly suggests that this is not a standard that all pilots are using. And a disproportionate percentage of these accidents involved pilots with 250’ cards or pilots who had recently qualified for their surface level cards.
- Mid-air collisions have claimed the lives of both rookies and veterans during the last two decades and, in most instances, the root cause was identified as failure of wingmen to maintain visual contact with team members.
- Our analysis supports a long-held assumption that Split S and reverse half Cuban maneuvers initiated with insufficient altitude to complete the maneuver are a leading cause of air show accidents, particularly among piston warbird and jet performers.
- Similarly, this review of accidents during the last 22 years confirms that snap rolls on a downline are a consistent problem in our industry.
- The circumstances in which G-induced loss of consciousness was a causal factor in different air show accidents vary widely from injuries and distractions to poor fitness and low levels of G tolerance early in the air show season. But awareness of G-related issues and potential problems should be a top priority for all air show performers.
- This detailed look at accidents during the last 22 years confirms that air show accidents and incidents in North America are decreasing. In every category, we have had fewer accidents, incidents and fatalities during the last eleven years (2008-2018) than we did in the eleven 11 years preceding them (1997-2007). But there is little room for complacency. We are still losing an average of two air show performers per year and, as air show legend Bob Hoover said nearly two decades ago, we are not coming up with new ways to do it. This article provides some specificity to Bob’s observation and a potential checklist for performers to use to increase their awareness of our industry’s most common causes of accidents.
- As helpful and illuminating as this analysis is, it makes even clearer the need for and value of similar, more formal and more extensive analysis of air show accident information, not just from the United States and Canada, but from all over the world.
To that end, ICAS has become involved with a new group, the International Air Show Safety Team (IASST). The IASST will use an extensive database of worldwide air show accident information collected by Major General Des Barker (South African Air Force, retired) as the starting point for a massive undertaking to document accidents and analyze them to develop useful, practical information for air show performers and event organizers.
The IASST envisions a database of several hundred accidents with factual, searchable information on all of them. This information resource will help the worldwide air show community get past intuition and suppositions and develop objective, verifiable analysis on a statistically significant sample of past accidents to further improve air show safety around the world.
If this analysis of the past 22 years of North American air show accidents and incidents tells us anything, it is that pro-active, sustained efforts to improve air show safety can produce meaningful, quantifiable results. It also suggests that increased data gathering, improved analysis and a recommitment to safety among everybody in our business can further reduce our industry accident rate. Yes, air shows can be a dangerous and unforgiving environment in which to fly, but there are ways to mitigate and even eliminate some of that risk.
(Editor’s Note: This is an expanded version of an article that originally appeared in the May 8, 2019 edition of the ICAS Operations Bulletin.)


