
Results of the 2018 Air Show Spectator Survey & 2018 Air Show Ticket Price Survey
Now a biennial tradition within the air show community for more than three decades, the ICAS spectator survey is a regularly updated and reliable source of detailed information on the millions of spectators who attend American air shows each year.
Since 1986, the International Council of Air Shows has conducted 17 separate spectator surveys. Since that first survey more than 30 years ago, the results have provided important insight on the demographic make-up of the spectators who attend North American air shows.
Traditionally conducted once every two years, the survey has become an important tool in helping air shows, performers and prospective sponsors better understand the make-up of those who attend our events…from their gender, age, household income and education levels to their preferences for different types of acts and their opinions about ticket prices.
The 2018 survey included responses from 1,715 adults at eleven different air shows – large and small, civilian and military – between May and October of last year.
Gender of Air Show Spectators, 2018 (blue) vs. 1998-2016 Avg.(red)
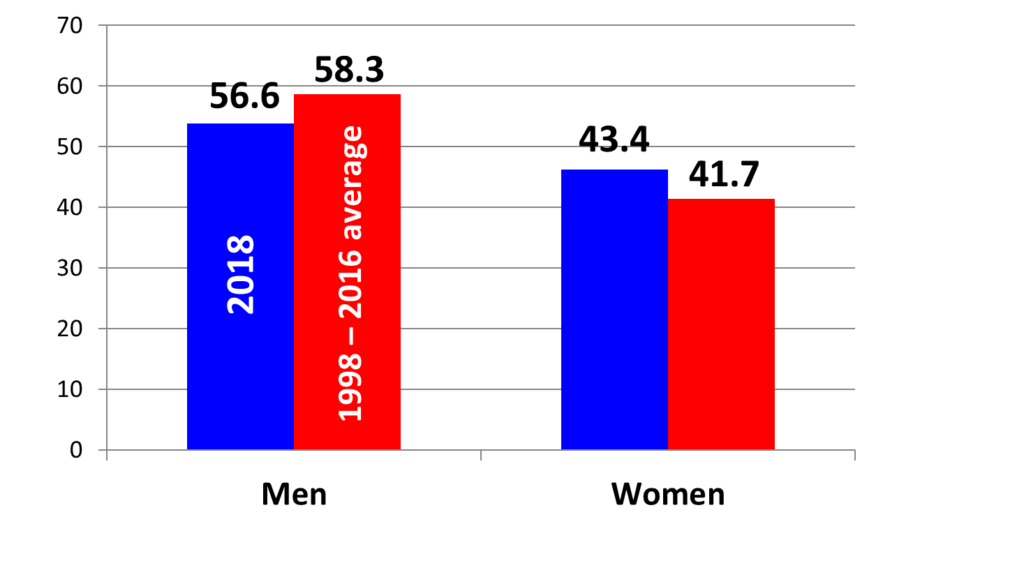
In part because the gender distribution for air show audiences has been consistent over many years and in part because air shows attract a comparatively high percentage of women, our male/female percentages make our events more attractive to most sponsors.
Did you attend today’s show with a child under 18 years of age (left)? If yes, how many children were in your group (right)?

Nearly half (44.3%) of the adults who attend air shows are accompanied by children. And those adults who come to an air show with children attend with an average of just over two children per adult.
This is a statistic that distinguishes air show audiences from many other sport and entertainment venues. The air show business claims to be a family-friendly entertainment venue because we are a family-friendly entertainment venue and these figures prove it.
Spectator Ethnicity, 2018 Responses (blue) vs. General Population (red)
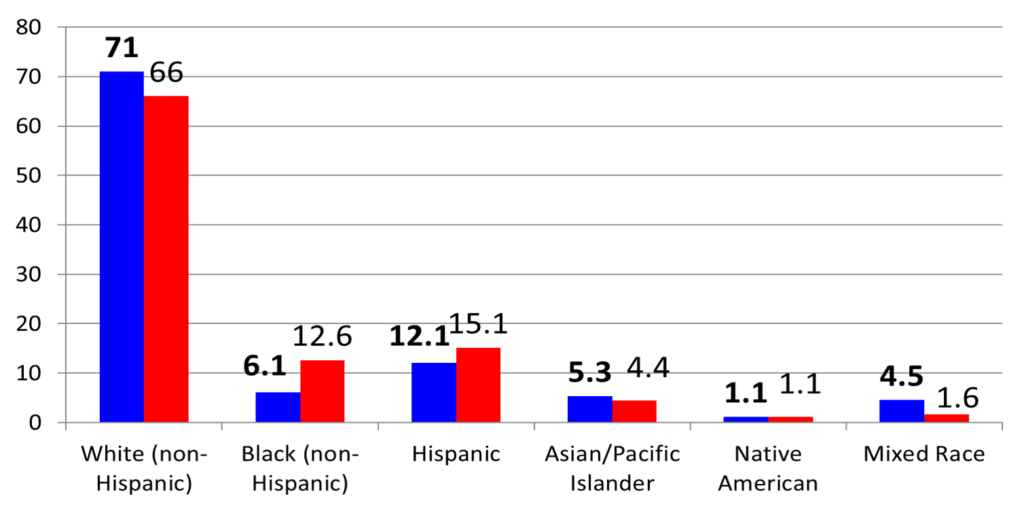
The results of our 2016 spectator survey included a significant decrease in the percentage of white/Caucasians in our air show audiences and a similar, nearly offsetting increase in the percentage of Hispanic spectators. In our 2018 survey, the changes were not as dramatic, but they indicate that air show audiences throughout the U.S. continue to become more diverse. As a percentage of overall attendance, white/Caucasian attendance dropped marginally, black percentages increased significantly and Hispanic percentages increased slightly.
Despite the fact that we are becoming more diverse, our air show audiences are still disproportionately white (as compared to the U.S. population) and still do not include as many blacks or Hispanics as the country as a whole.
Education Level of Spectators, 2018 (blue) vs. 1998-2016 Avg. (red) vs. NFL (green)
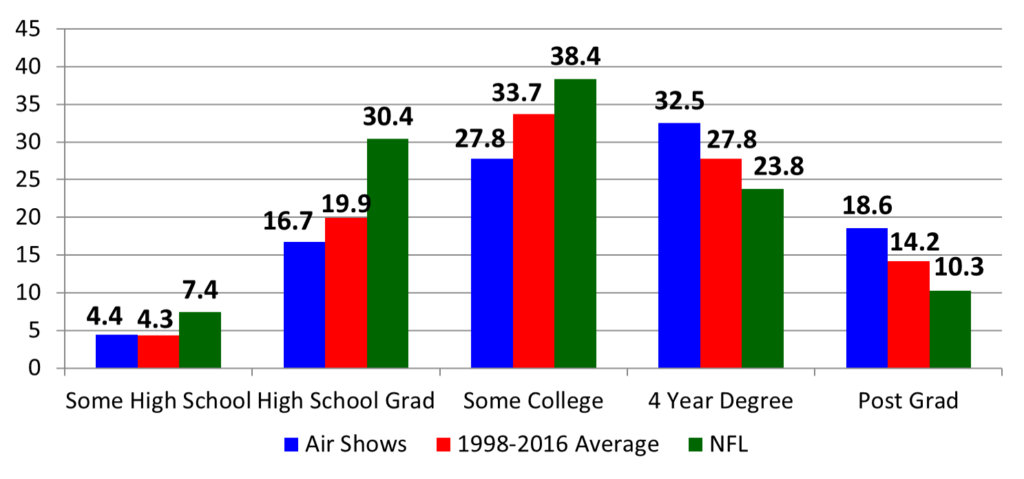
First, the educational levels of our air show spectators continues to increase. For 2018, we have lower percentages of spectators that have only a high school degree or some college education, as compared to the historic averages for past ICAS spectator surveys, and we have higher percentages of spectators with four-year degrees and post-graduate education.
Second, despite the much higher ticket prices at professional football games, air shows also attract a significantly more educated audience than the NFL. As you can see from the graph, air shows have significantly fewer spectators at the lower education levels and significantly more spectators at the higher education levels.
In fact, statistics consistently tell the same story: air show audiences are more educated and have higher household incomes than the audiences of all major professional sports, including the NFL, MLB, NBA, NHL and NASCAR.
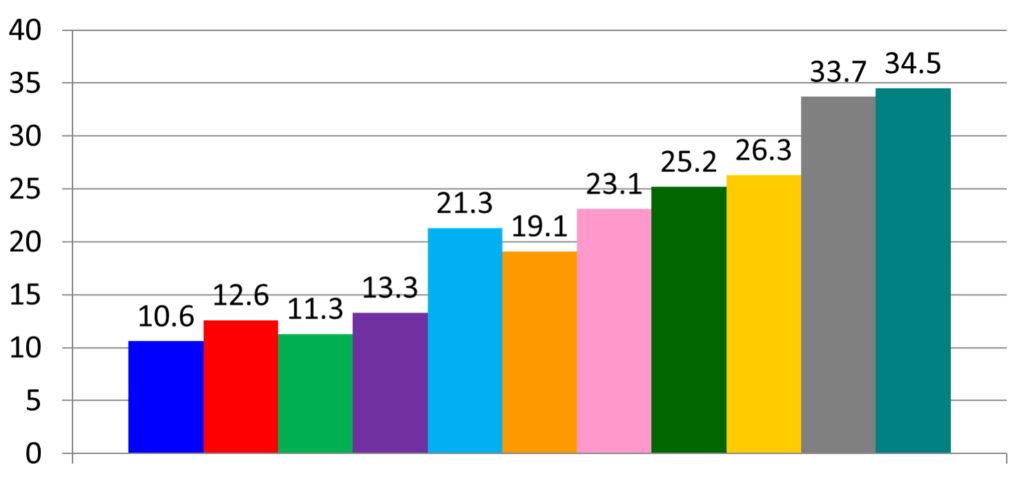
Household Income Level of Air Show Spectators, 2018 (blue) vs. 1998-2016 Avg. (red)
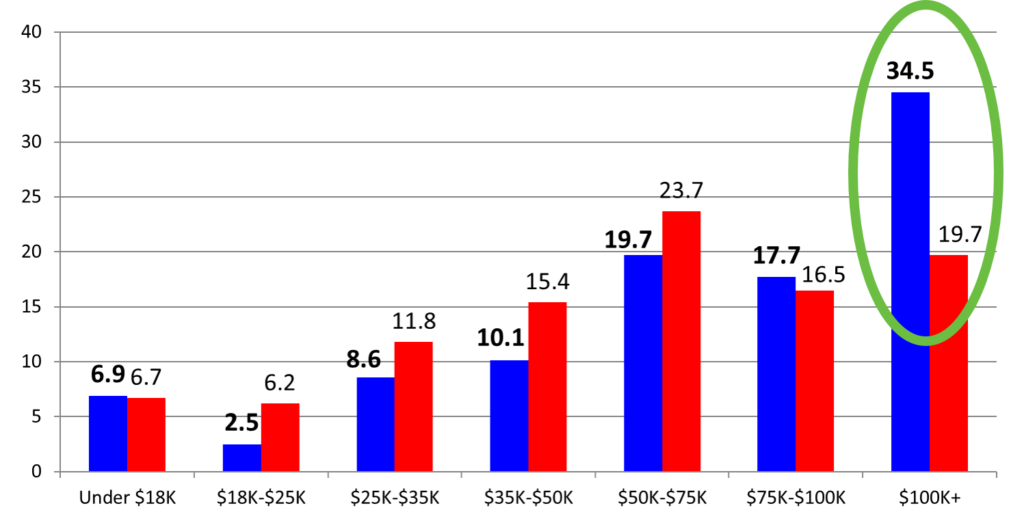
In our 2018 survey, percentages for the lowest five household income levels were lower than they were for the 1998-2016 survey averages. But the $75,000 to $100,000 level was up somewhat and the $100,000+ percentage is nearly double the historic average for 1998 through 2016. This continues a trend that we have seen for more than a decade. Today, more than one-third (34.5%) of those surveyed reported household income over $100,000.
Air Show Spectator Households Reporting Income of $100,000+, 1998-2018
During the last two decades, air show spectators with income exceeding $100,000 per year has more than tripled. The increase has been steady and dramatic. The data suggests that our air show audiences in 2018 are both more affluent than past air show audiences and significantly more affluent than virtually all other professional sports except golf and tennis.
Age of Adult Air Show Spectators, 2018 (blue) vs. 1998-2016 Avg. (red)
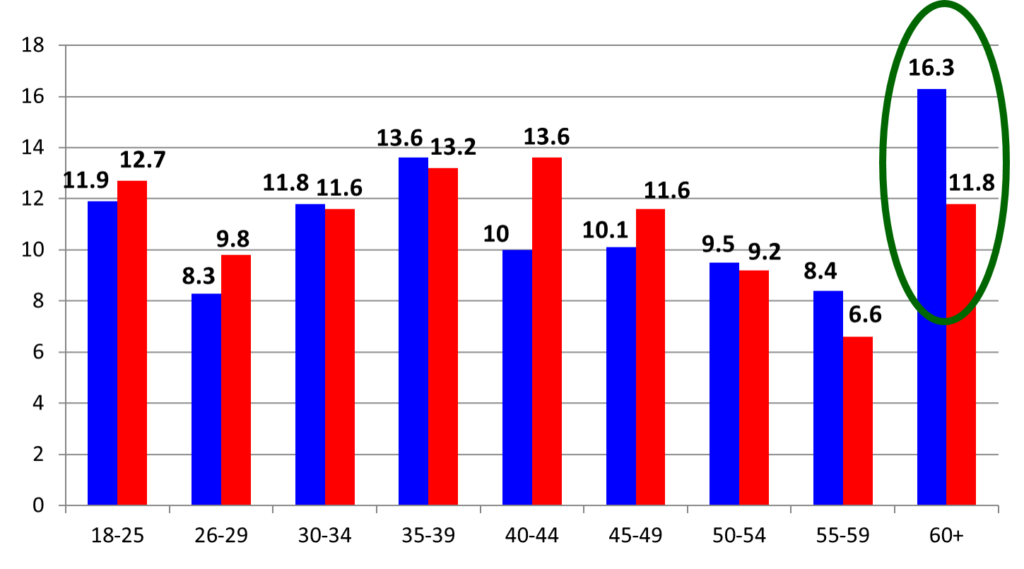
As compared to the historic 1998-2016 average, we have generally lower percentages of our audience in the 18-50 age group and higher percentages at the 50+ age groups, particularly the 60+ age group.
Left unchecked, this gradual but relentless increase in the average age of our air show audiences represents an existential threat to the air show business. If we don’t start to see increased percentages of our audience coming from the younger age groups, our total attendance will begin to decrease significantly as the 60+ spectators stop attending our events.
Air Show Spectators Reporting Age of 60+, 1998 – 2018
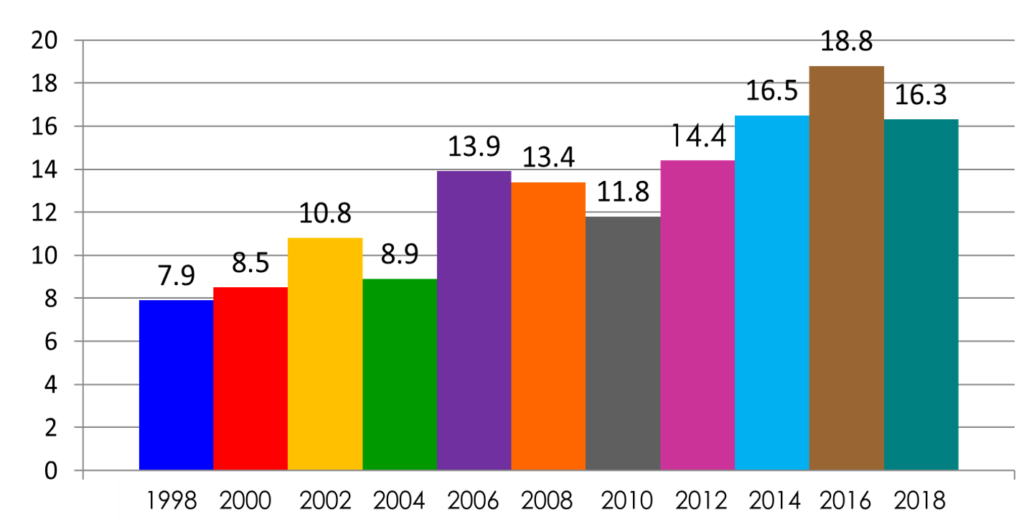
The impact is as obvious as it is important: our spectator base is aging and we are not taking the steps necessary to attract younger customers as the older spectators age and stop attending our events.
Much of the recent discussion within the air show community about the importance of attracting more Millennials and members of Generation Z is being driven by these statistics. If air shows don’t develop tactics and strategies for attracting visitors in the 20-45 age ranges, our attendance figures will slowly and steadily decrease until we are eventually servicing a much smaller, much older audience and generating significantly less revenue than we are today.
Distance Traveled to Attend the Air Show by Air Show Spectators, 2018 (blue) vs. 2008-2016 Avg. (red)
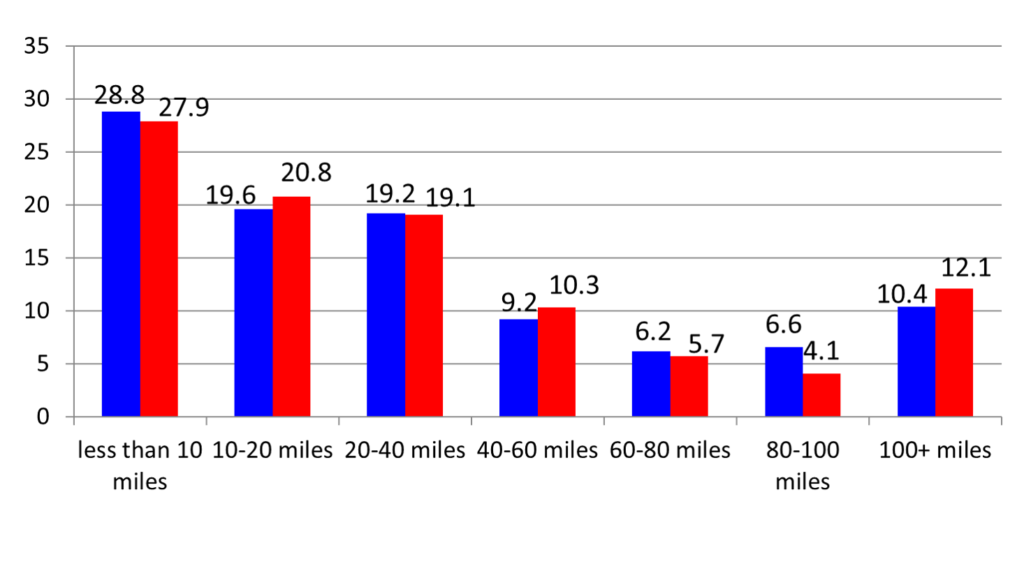
For more than 30 years, the responses to this question have been the most consistent and reliable figures from our biennial survey. Two-thirds of our spectators come from within 40 miles of the air show venue. A bit less than three-quarters come from within 60 miles. This general rule of thumb has not changed in more than 30 years.
Combined with the power of social media to target your audience with extreme precision, these figures constitutes a road map on how to direct your marketing efforts to those people who are most likely to attend your event.
What were the main attractions for you at this air show? 2018 (blue) vs. 2000-2016 Avg. (red)
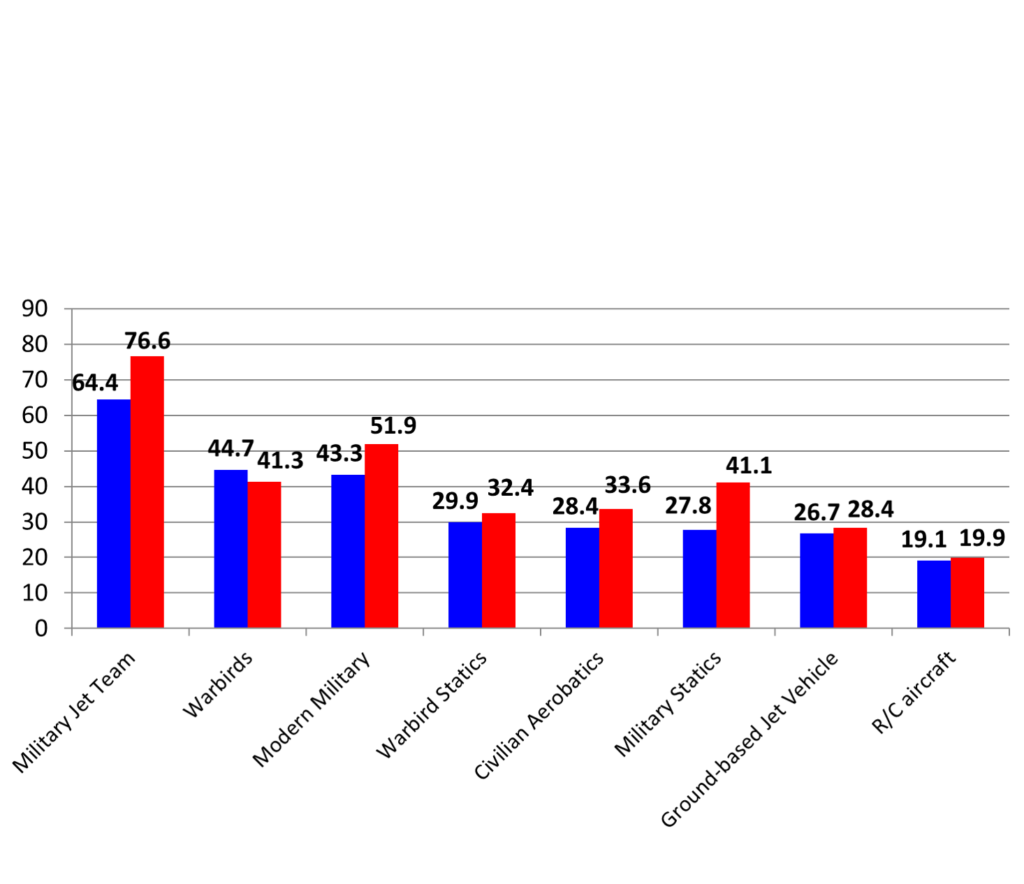
For many years, the military jet teams have been the biggest attraction to U.S. air shows. And the results of the 2018 spectator survey see no change in that fact.
But, for the first time ever, performing warbirds have overtaken single-ship demo presentations. Indeed, in 2018, spectator responses put warbirds second behind only the jet teams.
This could be a statistical anomaly or it could be an indication that warbirds are growing in popularity, but – from an event organizer’s perspective – it’s useful to recognize the growing attraction of vintage World War II aircraft and the importance of developing a balanced show schedule that includes a wide range of act types.
How did you hear about today’s air show? 2018 – 2012 Responses
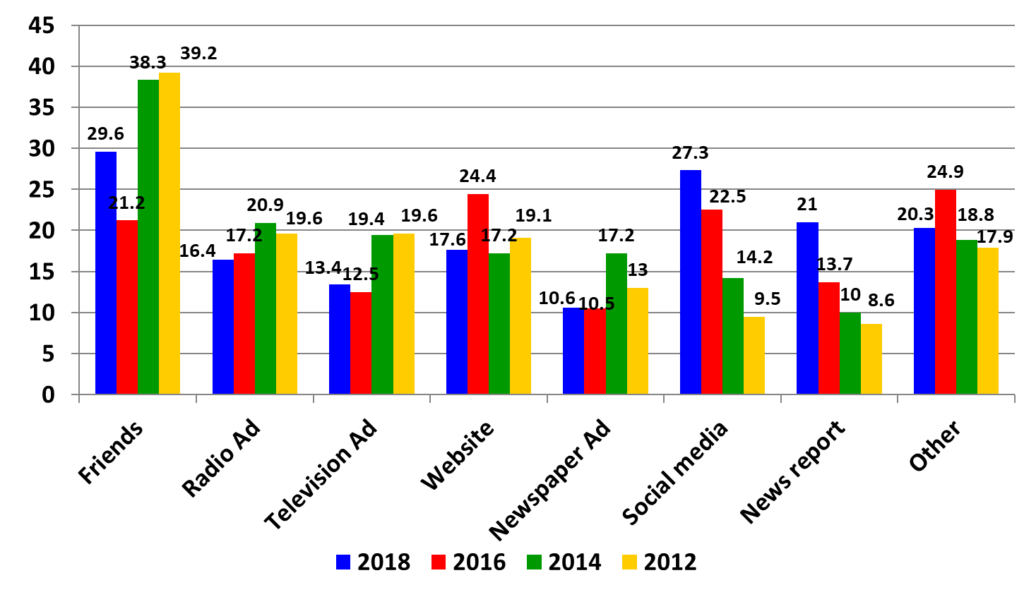
Specifically, the impact of “legacy media” (radio, television and newspaper ads) has declined precipitously while social media and news reports have become dramatically more effective.
Our customers are clearly telling us that they are getting their information from different sources than they were just a few years ago. If we don’t listen to them and make appropriate changes to how we spend our marketing budget, we run the risk of wasting scarce cash or, worse, failing to reach prospective ticket buyers at all.
How would you describe the cost of your air show admission ticket? 2018 – 2012 Responses
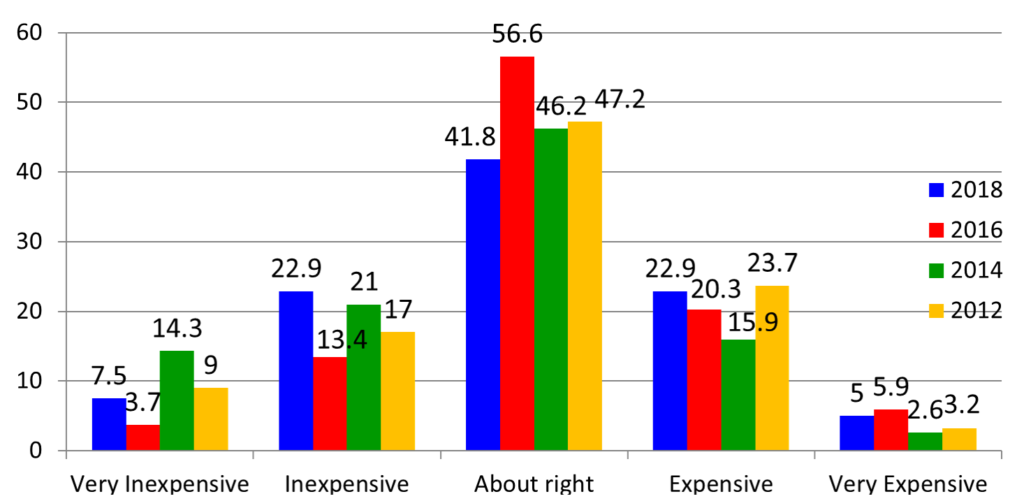
Nonetheless, when given an opportunity to express concern about ticket price in our 2018 spectator survey, just 26% of the survey respondents identified ticket prices as expensive or very expensive. This represents a significant increase compared to those responses of an identical question in the 2016 survey, but nearly three quarters were either neutral on the question or said that ticket prices are inexpensive or very inexpensive. According to ticket pricing experts, this indicates that the air show industry is leaving money on the table and that ticket prices could be significantly higher without impacting attendance.
U.S. Air Show Ticket Prices, 2008 – 2018 (Adult, On-Site, Non-Discounted Tickets)
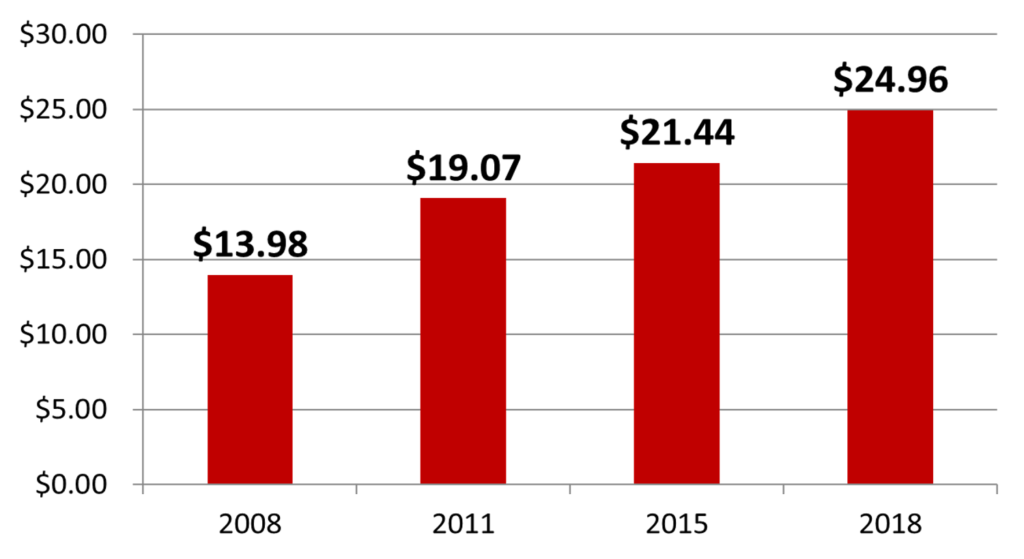
In November of last year, more than 100 event organizers reported the cost of their on-site, no discount adult general admission ticket price. ICAS compared that to similar data from identical surveys conducted in the fall of 2015, the fall of 2011 and the fall of 2008.
The increases are small and gradual, but ticket prices are trending up.
U.S. Air Show Ticket Prices 2015 vs. 2018 (Results of ICAS Member Surveys Conducted in October 2015 and November 2018)
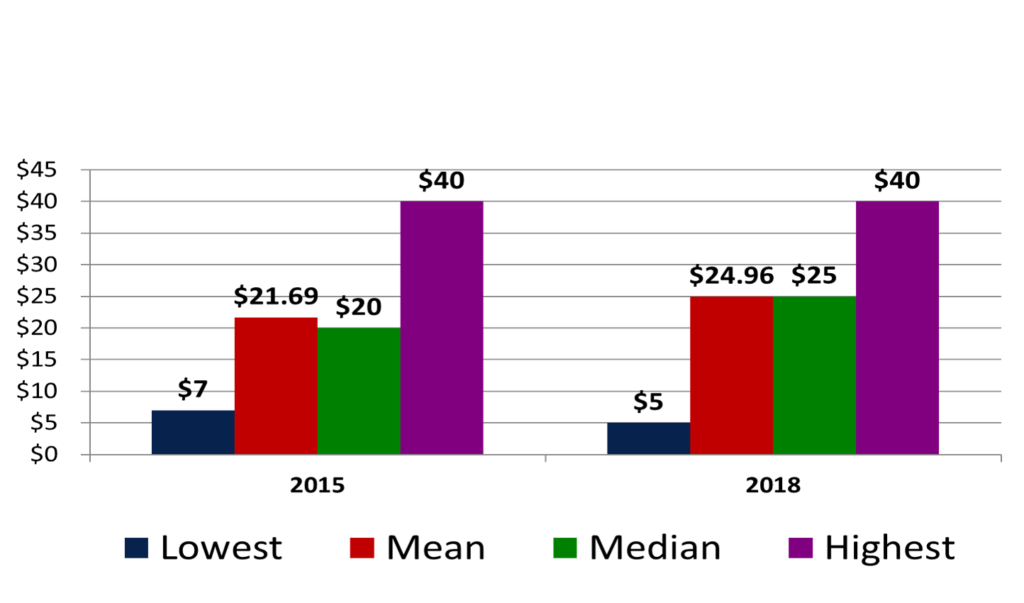
Although there is no specific data to support this observation, it appears that both the $25 ticket price and the $40 ticket price represent psychological limits for many of our event organizers.
The data suggest (but does not say conclusively) that, for now, many of those shows open to raising their ticket prices see the $25 price as a “do not cross” limit. Similarly, $40 appears to be the highest that even our most aggressive U.S. shows are willing to go for a general admission ticket.
Parking Fees (for shows that charge both admission and parking) 2015 vs. 2018
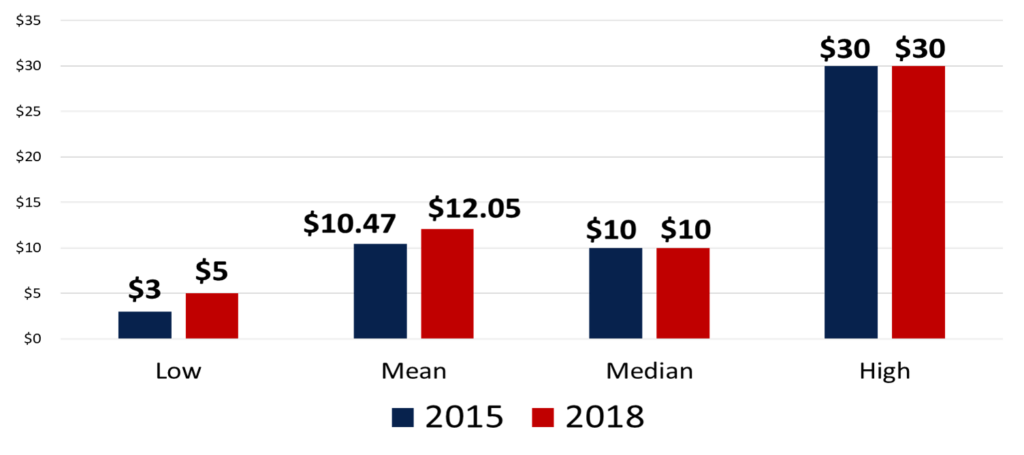
Interestingly, both the median parking fee ($10) and the highest parking fee ($40) remained the same.


