
Introduction
Since 1986, the International Council of Air Shows has conducted 16 separate spectator surveys. Since that first survey more than 30 years ago, the results have provided important insight on the demographic make-up of the spectator base that attends North American air shows. The survey responses have also been remarkably consistent during those three decades, suggesting both that the methodology for conducting the survey is sound and that the demographic profile has evolved steadily during the last 30 years.
Traditionally conducted once every two years, the survey has become an important tool in helping air shows, performers and prospective sponsors better understand the make-up of those who attend our events…from their gender, age, household income and education levels to their preferences for different types of acts, their opinions about ticket prices and their recommendations on different areas for possible improvement.
In close coordination with a professional research agency, ICAS developed a protocol for conducting the surveys that ensures a random sample of adult spectators at each show and a representative cross-section of air shows – military and civilian, big and small, paid admission and free — throughout the United States.
In 2016, 2,095 adult spectators (over the age of 18) at twelve different events between May and November provided responses to a series of 20 questions that focused on demographic information and each spectator’s opinions about the particular air show they were attending when they completed the survey.
The information gleaned from the 44,000 answers gathered during the 2016 air show season can be eye-opening and valuable to you in your work as an air show professional. These statistics take the guess work out of understanding who constitutes our air show audience. Some of the questions help us to identify what these customers are expecting when they attend our events or watch our performances.
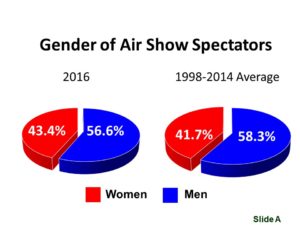
Over time, the gender distribution of adult spectators has varied very little. The percentage of males has never been higher than 61.1% and never lower than 56.0%. By comparison, the percentage of males at National Football League games in 2015 was 65.0% and the percentage of males at 2015 NASCAR races was 60.1%.
For most advertisers and sponsors, a more balanced audience of men and women is considered desirable.
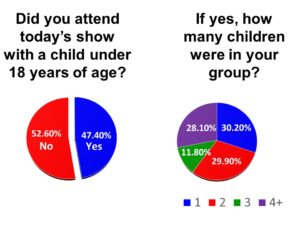
Although this is a new question for the biennial ICAS Spectator Survey, results confirm what many of us know intuitively: that air shows attract a large number of children. Nearly half of all adult spectators attend our events with children under the age of 18. And, of those that do attend with children, they are accompanied by an average of 2.2 children.
Similar statistics for NFL and NASCAR are not available, but – with average ticket prices of $85 (NFL) and $96 (NASCAR) – it’s unlikely that those venues attract nearly as many children.
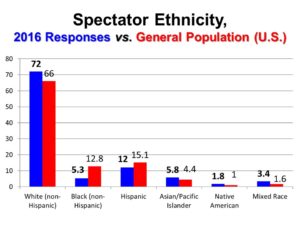
Gradually, the ethnic make-up of our air show audiences is starting to look more like the ethnic make-up of the United States. Historically, air show spectators have been disproportionately white with significantly fewer minorities than the population at large. But, in 2016, that began to change, with a significant (6.8%) decrease in the percentage of whites and a significant increase (5.5%) in the percentage of Hispanics.
When compared to the general U.S. population, ICAS survey results in 2016 reveal that air show audiences are still underrepresented among blacks and overrepresented among whites. But our customers now look much more like the country as a whole than they did just a few years ago.
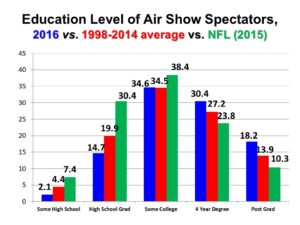
Over the years, the ICAS spectator survey has charted a significant and steady increase in the overall education level of air show audiences. In this graph, those changes can be seen most clearly in the small number of “Some High School” responses and the large number of “Post Grad” responses when compared to the averages from the previous nine surveys. But even that comparison does not paint a clear picture because we are comparing 2016 data to averages from the previous nine surveys conducted over 18 years and that has the effect of muting the steady and dramatic changes. In 1998, for instance, 7.6% of survey respondents reported that they had “some high school” education as compared to 2.1% in 2016. Eighteen years ago, 10.9% of those surveyed said that they had post-college education as compared to 18.2% in 2016.
The high level of education among our air show audiences is even more clearly and dramatically depicted when we compare results from our 2016 survey to similar data generated by the National Football League in 2015. A typical NFL ticket holder is more than three times as likely to have had “some high school” education and is more than twice as likely to be a high school graduate than an average air show attendee while our air show audiences have 77% more people with post-college education experience.
Together with figures on household income, these statistics on education level are the principal basis for our industry’s assertion that air show audiences are among the most affluent of all spectator events…more on a par with golf and tennis audiences than professional football or NASCAR spectators.
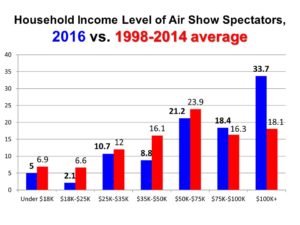
Similarly, over the years, the increase in household income reported by air show fans is a testament to the affluence of our spectator base.
When compared to the previous nine-survey average, we see that the lower income levels have all decreased, but the average percentage of audience members reporting household income greater than $75,000 per year has increased from 34.4% in all previous ICAS surveys to 52.1% in 2016. And, although statistics from any one past survey are not included in this graph, it’s interesting to note that, in 1998, slightly more than one-tenth (10.6%) of air show audience members surveyed reported household income in excess of $100,000. Today, more than one-third (33.7%) indicated household income over $100,000.
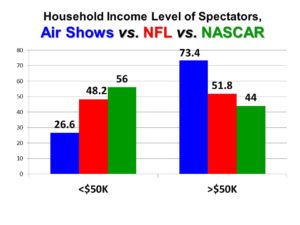
A comparison of the household incomes for 2016 air show audiences to 2015 NFL and NASCAR audiences also highlights the affluence, buying power and sponsor appeal of our air show fans. Our air show audiences include half as many people who make less than $50,000 as compared to a NASCAR ticket holder. And the percentage of our audiences that report household income higher than $50,000 is significantly higher than either professional football or NASCAR. Obviously, there is nothing inherently good about people who make more than $50,000 or bad about people who make less than $50,000, but the higher buying power of a more affluent spectator base is more attractive and valuable to prospective sponsors.
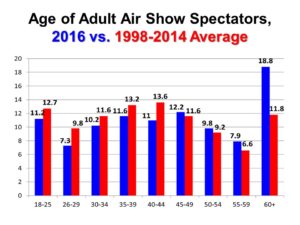
Our air show audiences are growing older. When compared to an average of survey responses during the last 18 years, we attracted a lower percentage of adults in the 18-44 range and a higher percentage of adults in the 45-60+ age range during the 2016 air show season.
This is a trend that is both a concern and an opportunity.
On the one hand, a continually aging spectator base is unsustainable. As the average age gets higher and the percentage of younger spectators gets lower, our industry runs the risk of losing significant portions of its audience. If this trend and the reasons behind it are not addressed, we could begin to see a steady decrease in the number of spectators at our events as our “typical” spectator passes away or becomes too old to spend a day on the air show ramp.
On the other hand, the drop in the percentage of audience members in the 18-45 age range suggests a clear strategy for increasing attendance. Identifying tactics and features that will make our events attractive to younger customers could generate sizable bumps in attendance.
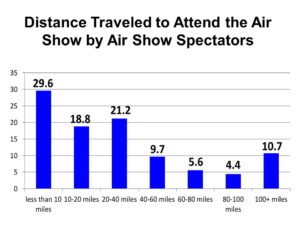
Perhaps one the most practical and straight forward questions that we ask in each of our biennial surveys, the responses to this question have stayed consistent for nearly three decades and have the potential to dramatically impact your event’s marketing efforts.
Nearly half (48.4%) of your audience comes from less than 20 miles of your show site. And just 20 percent travel more than 60 miles to attend your event. Tens of thousands of survey responses gathered over three decades suggest that your marketing efforts should be tightly focused on the area immediately surrounding your show site. And, with the advent of micro-targeted internet advertising tools, air shows throughout North America have never been in a better position to focus their marketing efforts on the cities, towns, counties and neighborhoods mostly likely to send spectators to your event.
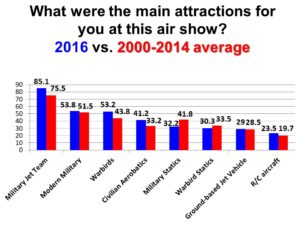
As has been the case for the entire time that ICAS has conducted this survey, military jet teams are – by a wide margin – the most popular act at any air show at which they perform.
Perhaps more interesting this year is some fairly significant changes to some of the other statistics in this graph. For many years, “modern military, flying” (single ship demo) was a distant, but clear second to military jet teams. This year, “modern military, flying” and “vintage aircraft, flying” (warbirds) were virtually tied.
For a survey that traditionally sees only small changes from one year to the next, this is a significant development…and an important one for event organizers planning their 2017 or 2018 show schedule. A typical North American air show has only minimal capacity to influence whether or not they receive contemporary military support. But a show’s ability to include warbird performances is limited only by its ability to write the required check. And now, our survey results suggest that those single ship fighter demos and warbird acts are just about equally attractive to your audience.
If we look more closely at the year-by-year responses to these questions, it’s clear that this is a trend that has been developing for several years. The overall reduction in the availability of single ship demo performances during the last 6-8 years seems to be having a cumulative effect. The sharp increase in the attractiveness of warbird performances is, however, a more sudden phenomenon. After many years of hovering in the high thirties and low forties, this figure shot up by ten full points in our 2016 survey, perhaps an indication that our audiences are accommodating themselves to the new circumstances of our contemporary military’s decreased participation in air shows around the country. This is mirrored by a dramatic decrease in the comparative popularity of “military statics,” an indication, perhaps, of the much less active role that our contemporary military has played in providing static display aircraft for air shows during the last 4-5 years.
Civilian aerobatics (Extras, Pitts, Stearmans, etc.) improved from a reliable sixth place popularity for many years to a fourth-place popularity, largely on the strength of an increase of eight full percentage points.
The takeaway point here is that our audience’s preferences and expectations are changing…perhaps as a result of a decrease in military participation, but changing nonetheless.
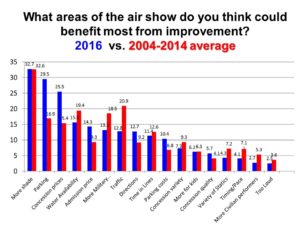
For the last seven spectator surveys, we have provided survey respondents with an opportunity to express concerns about different aspects of the show. Unlike virtually all of the other questions, the responses to this particular question vary – sometimes significantly – from one year to the next and even from one show to another within a particular year. Still, for identifying issues of concern in a general way, the responses to this question are helpful and insightful.
Consistently, in every year and at every show, lack of available shade is identified as the most prevalent and persistent problem. There are solutions to this problem on the air show ramp, but – whether your event chooses to use some of these tools or not – it’s important you know that lack of shade is widely perceived as a shortcoming of air shows.
Parking and traffic are also consistently identified as two of the top six or seven problems by our customers. As you can see in this graph, parking was identified as a bigger problem this year than it historically has been and traffic was a bit less of a problem than past surveys have suggested it is.
If we ignore the ups and downs of any one year (including 2016) and focus instead on those issues that have consistently been identified to be among the top five in air show spectator concerns, they are – in order – lack of shade, traffic, water availability, lack of sufficient number of military performers and parking.
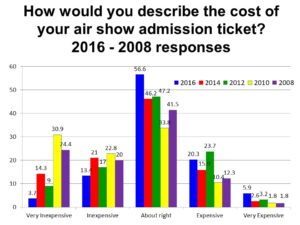
Since 2008, ICAS has been asking a very specific question about the customers’ perspective on the price of admission for the air show. Answers to this question at shows that do not have an admission fee are not included in the calculations that we have used here.
Generally, the percentage of survey respondents who say that admission fees are very inexpensive have been in a general, but inconsistent decline. This correlates with an increase in ticket prices during the last several years (quantified in a separate ICAS survey of members) from a bit more than $12 in 2006 to more than $18 in 2016 (on-site, adult, non-discounted price).
Still, when given an opportunity to express concern about ticket price, just 26.2% of survey respondents identified ticket prices as expensive or very expensive. Nearly three quarters were either neutral on the question or said that ticket prices are inexpensive or very inexpensive.
Moreover, air show ticket prices are still significantly lower than virtually every comparable entertainment option for adults and families. One-day admission tickets to one of North America’s 18 Six Flags theme parks cost between $37 and $62. Major League Baseball says that its average ticket prices are $31…and remember that each MLB team has 81 home games per year. As noted earlier, average ticket prices for an NFL football game in 2015 were $85. In the same year, you would pay an average of $96 to attend a NASCAR race. The average ticket price for an air show – an event that typically comes to a community for just two or three days each year – is less than $20.
For an industry that has long been cash-starved, there is little question that increasing ticket prices represents a fast, easy, low-risk tactic for increasing revenue.
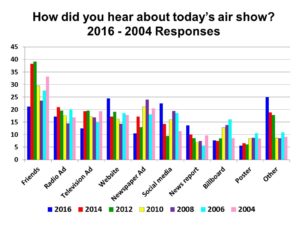
This graph illustrates the revolution in air show marketing that has been occurring during the last decade. Look closely at this data and you’ll see that, as the impact and reach of television commercials and newspaper ads has decreased, the effectiveness of websites, social media and email has increased. Our customers are telling us as clearly as they can that they are getting their information from different sources than they were just a few years ago. If we don’t listen to them and make appropriate changes to how we spend our marketing budget, we run the risk of wasting scarce cash or, worse, failing to reach prospective ticket buyers at all.


