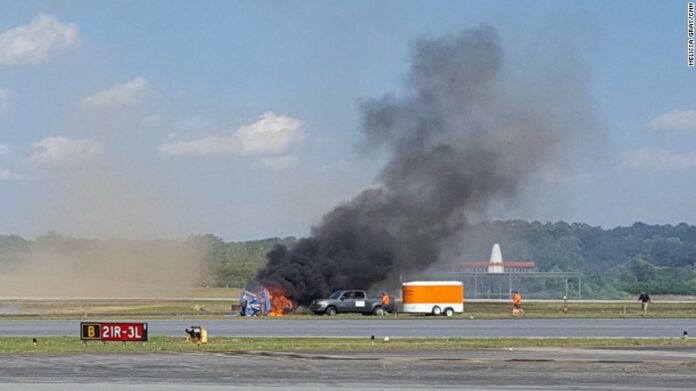
As we move into the busiest portion of the 2019 North American air show season, the ICAS staff recently took a retrospective look at air show and practice accidents during the last 22 years. (Note: These statistics do not include air race accidents, cross-country accidents or accidents involving static display aircraft arriving at or departing from an air show. The statistics do include accidents involving air show practice accidents and rides conducted before or after air shows.)
Between June 1, 1997 and October 12, 2018, there were 93 accidents and major incidents involving air show pilots in the U.S. and Canada or 4.2 accident/incidents per year. Of those 93 accidents and incidents, 60 (64.5%) occurred during first 11 years of that 22-year period (5.5 per year) and 33 (35.5%) during the second 11 years (3.0 per year).
Among the 93 accidents and incidents since 1997, 62 (66.7%) occurred during an air show, 28 (30.1%) occurred during a practice session, and three (3.2%) happened during a photo mission or incentive ride.
Of the 93 accidents and incidents between 1997 and 2018, 57 involved single fatalities, 13 involved two fatalities in the same accident, and 23 did not include fatalities. That means that 75.3% of all air show accidents and incidents involved at least one fatality. In the 22 years that ICAS analyzed, there were 83 total fatalities or 3.8 fatalities per year…55 fatalities during the first eleven years of that 22-year period (5.0 fatalities per year) and 28 fatalities during second eleven years (2.5 fatalities per year).
Among those accidents involving two fatalities, five were mid-air collisions, four involved military aircraft with a crew of two, three involved post-show or pre-show aerobatic rides with passengers, and we had a single accident with two fatalities that involved a pilot/wingwalker team.
Of the 93 accidents reviewed between the beginning of the 1997 air show season and the end of the 2018 season, 76 (81.7%) involved civilians and 17 (18.3%) involved military.
Of the 76 accidents involving civilians, 60 involved 63 pilots who held Statement of Aerobatic Cards issued by the FAA or Transport Canada at the time of the accident: 33/52.4% had unlimited/surface cards, 14/22.2% had 250’ cards, eight/12.7% had 500’ cards and eight/12.7% had 800’ cards. In 2019, 55.4% of the total number of SAC cards are surface cards, 25.5% are 250’ cards, 12.4% are 500’ cards and 6.7% are 800’ cards. Which means that the percentage of accidents involving surface card holders, 250’ card holders and 500’ card holders correlates roughly with the overall percentages of pilots holding cards at those levels. The only place where we see a spike is with pilots holding 800’ cards. Although just 6.7% of all current SAC cards are 800’ cards, 800’ card holders account for 12.7% of accidents between 1997 and 2018.
Although the precise cause of an accident — particularly a practice accident — is not always possible to determine, there are several types of recurring accidents. The most common during this 22-year period were:
1) insufficient altitude to recover from spin and/or gyroscopic maneuver (12);
2) engine failure or other mechanical problem (9);
3) mid-air collisions (7 with 10 fatalities);
4) Split S or reverse half Cuban in which the pull was initiated to low to allow enough altitude to recover (6);
5) insufficient altitude to recover following multiple snap rolls on a downline (5); and
6) G-LOC-related accidents (4).
ICAS will publish a more lengthy and detailed version of this article in a future issue of Air Shows Magazine. In the meantime, we urge all of our members to consider this simple observation made by the late Bob Hoover during a safety discussion at the ICAS Convention in 2000: “We are not coming up with new ways to die at air shows; we’re repeating the same mistakes over and over.”


